TOP 5 Freelance Platforms’ Client Report Pages Analyzed & Compared
You can tell a lot about a certain freelance platform by looking at its Reports


DISCLAIMER:
All Clients Reports-related information, charts, figures, and pictures (screenshots) have been obtained from the following publicly accessible official web pages: Upwork, Hubstaff, Freelancer, Toptal, and goLance, for comparison purposes only.
Analysis and comparisons are presented within this article with no intention to favor or diminish any of the above-mentioned freelance websites in particular.
INTRODUCTION
Reports are an invaluable tool for clients that manage remote teams. Easy to use, transparent, and fully customizable reports save time, keep clients up to date with all project status changes, and ensure cost control.
You can tell a lot about a certain freelance platform by looking at its Reports. So, without further ado, let’s analyze and compare Reports pages for clients of the top five freelance platforms:
Upwork
The first thing you will notice when visiting an Upwork’s Reports page (link) is an impressive number of available reports - 11 (eleven) in total. However, this number of Upwork reports can be a double-edged sword for clients. It goes without saying that you can get so many useful pieces of information by using more than one Upwork report. On the other hand, this can be a time-consuming task for some clients who prefer the “centralized” reports page where they can have an all-in-one place overview.
It is also worth mentioning that a client’s opportunity to use a certain type of report is determined by the pricing plans: Basic, Plus, Business, or Enterprise. For example, one of Upwork's essential reports - Weekly billing summary “is only available via email on Upwork Basic.” This means that Upwork’s clients who’re using the Basic pricing plan can get their report only in an email (presumably at the beginning of the next working week with the data from the previous working week).
Here’s a screenshot of this report you can see for free on Upwork’s official website (Reports page):
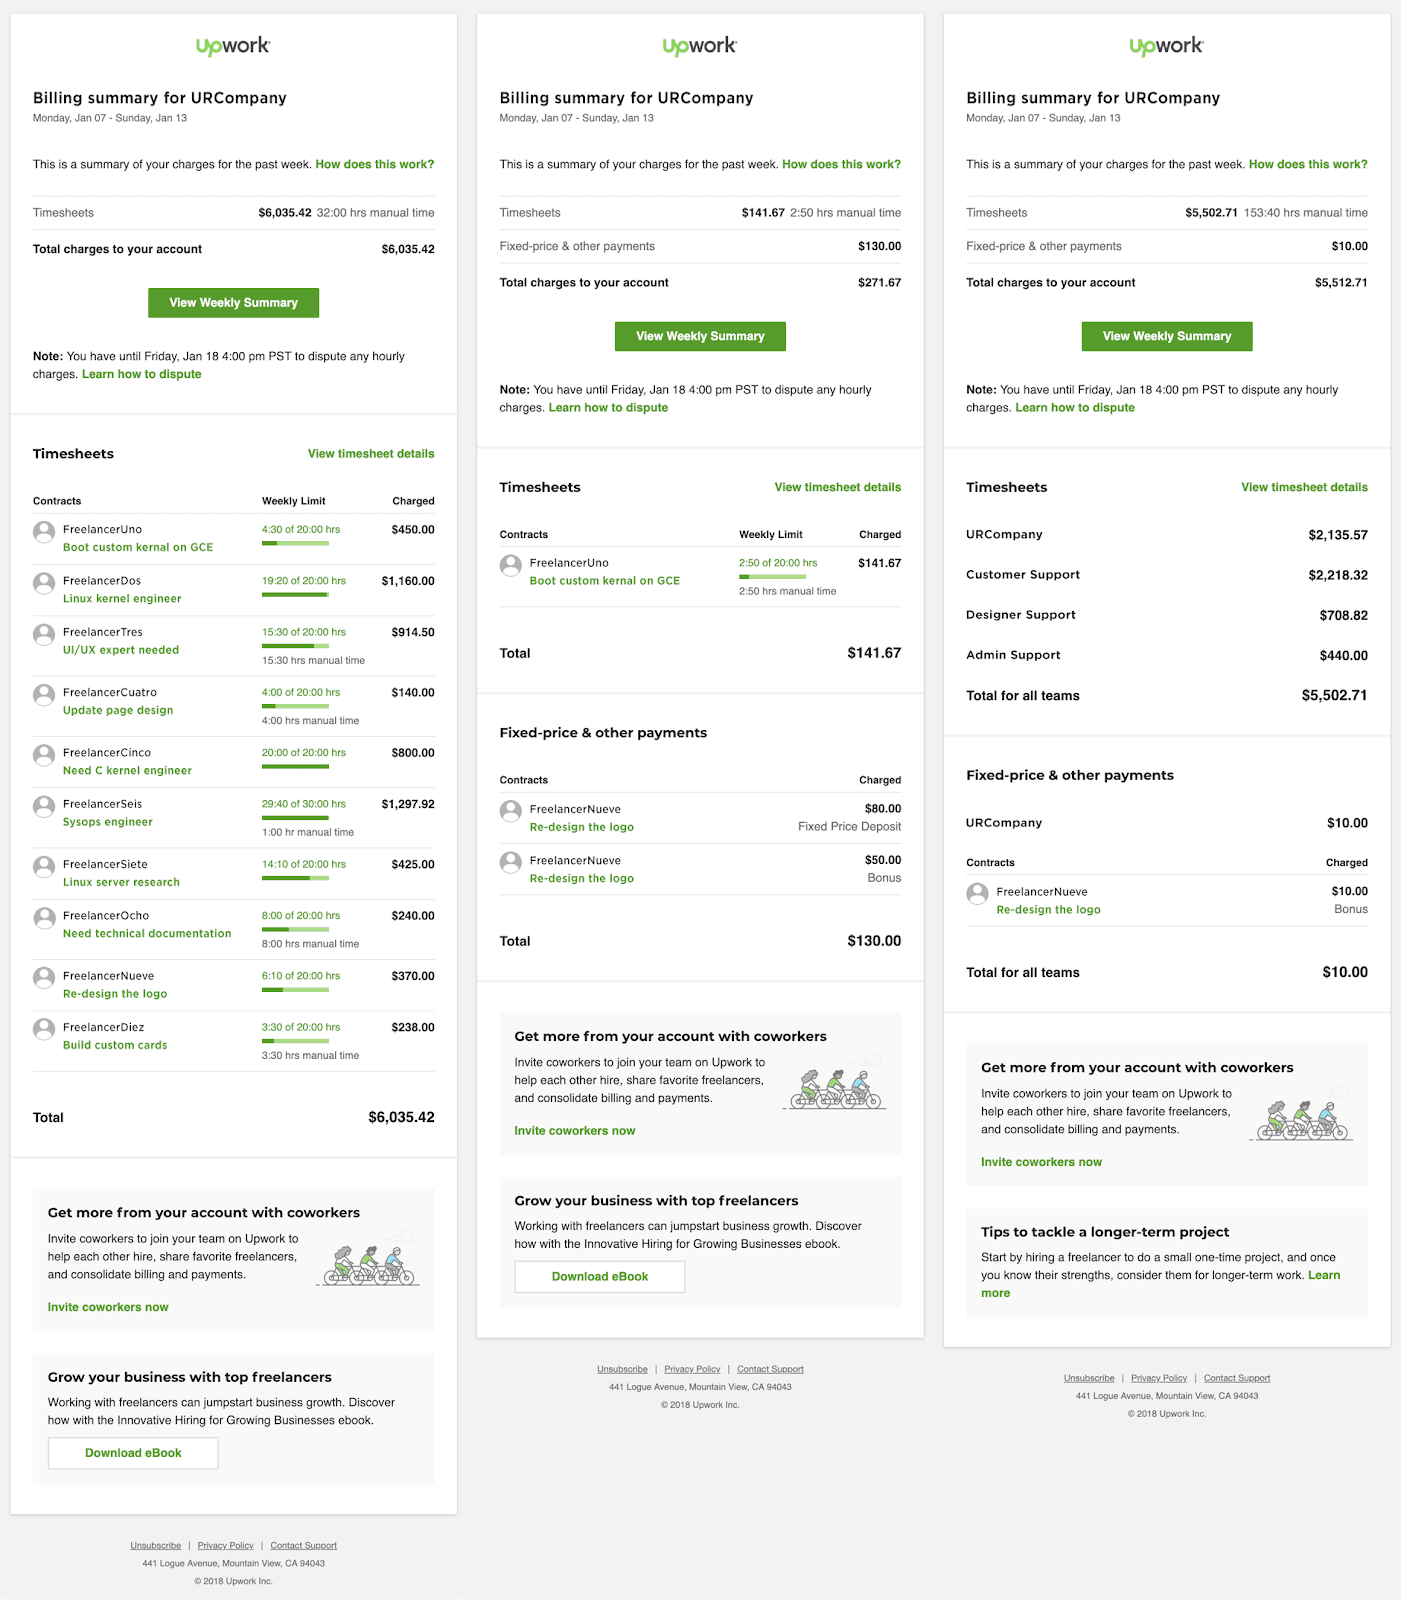
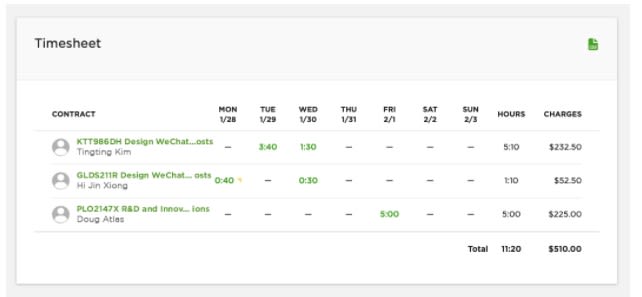
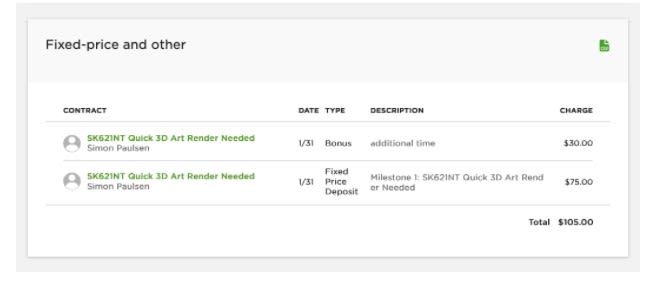
Upwork organizes the data in their billing summary in the following ways: “Time logged using the Upwork Desktop App is listed under Timesheet, while time added manually by your freelancer/s can be seen under Manual time. Escrow deposits, weekly salary, bonuses, and other manual payments will be listed under Fixed-price and other.”
The following screenshots illustrate what a client sees when the pieces of information are presented separately as mentioned and explained above:
Hubstaff
Hubstaff Talent has a different approach when it comes to reports for their clients. As you can see from the attached screenshots, this platform favors the “centralized” approach of presenting the reports.
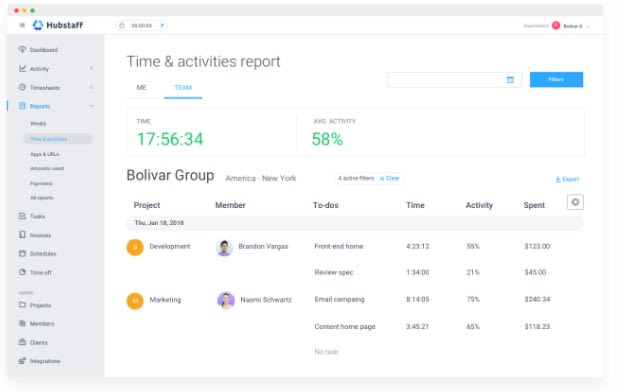
In addition, Hubstaff's reporting system covers both timesheets and manual time working details. This platform pays attention to customized reports. Here’s a quote from their official website: “View your time reports however you’d like. Download them directly from Hubstaff in whatever file format you need and quickly send any of your reports to anyone.”
It’s a well-known fact that Hubstaff leaves it up to their users both clients and freelancers, to regulate all payment-related activities and obligations independently and unrelatedly to the platform itself. However, it is worth mentioning that “Hubstaff pricing starts at $5.00 per user, per month.”
Freelancer
As you can learn from the first line in this platform’s “Financial Dashboard” section, this “is a one-stop-shop for all money matters.” Furthermore, Freelancer’s reports don’t make a distinction between clients and freelancers.
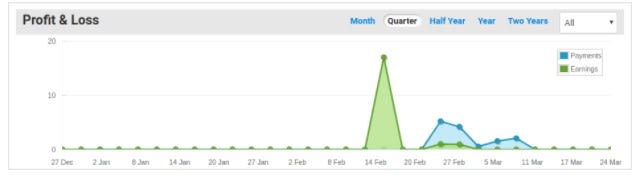
“The first thing you’ll notice is the Profit & Loss graph, which gives you an overview of your total earnings and expenditures on Freelancer.com over time.”
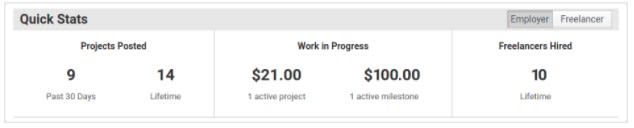
Undoubtedly, the most useful section of Freelancer’s reports is the Quick Stats table, as presented with this image:
The remaining instructions on their Financial Dashboard page focus entirely on financial statements.
Toptal
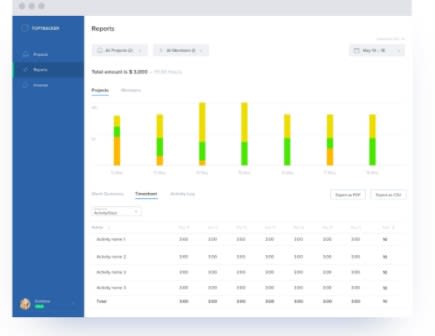
Just like Hubstaff, Toptal also puts a strong emphasis on “Centralized View Of All Projects” as illustrated below:
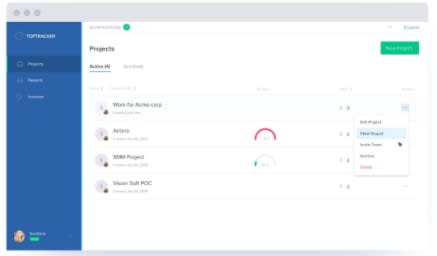
Toptal also cares about the detailed real-time productivity reports:
GoLance
The goLance Team has put a great deal of thought, creativity, and effort into new and improved UI/UX features. As a result, the completely redesigned and improved Reports page has become available to goLance users. GoLance Reports have implemented all advantages of the existing reporting systems in the freelance industry.
GoLance has a no-cost-to-client policy from day one. This approach reflects on Reports, as well.
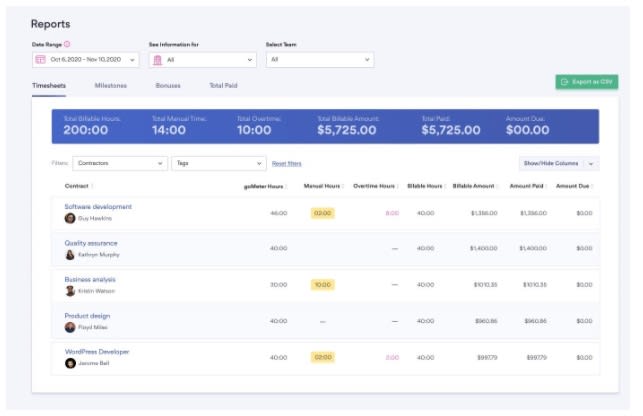
The first thing you can notice is the modern user-friendly interface, simplicity, and ease of use, and navigation. As you can see in the first screenshot, this is an example of centralized reporting at its finest.
All elements required for customizing a report are available on one page.
At the top of the goLance Reports page, you can adjust the preferred data range and choose a currency. The most useful option is to be able to select the whole company or look for reports associated with the particular teams and individual team members.
With just one click you can instantly navigate between Timesheets, Bonuses, and Milestones tabs. Or you can go straight to the Total Paid tab as illustrated below.
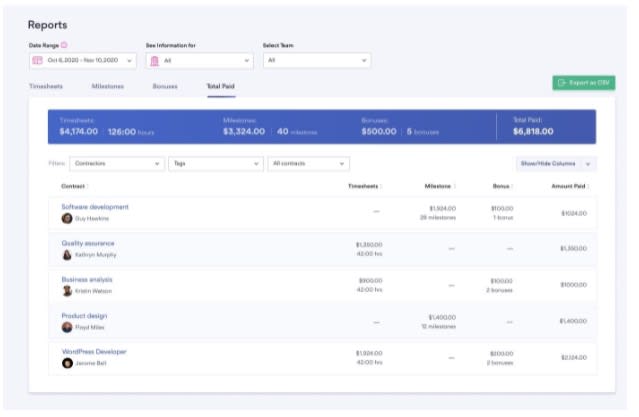
You don’t have to worry about the number of remote teams or freelancers you would like to include in your reports because the goLance reporting system will process and present all figures quickly and easily.
GoLance clients have a unique opportunity to analyze their reports to the tiniest details thanks to two filters and an option to hide or show columns of the greatest importance at the given moment.
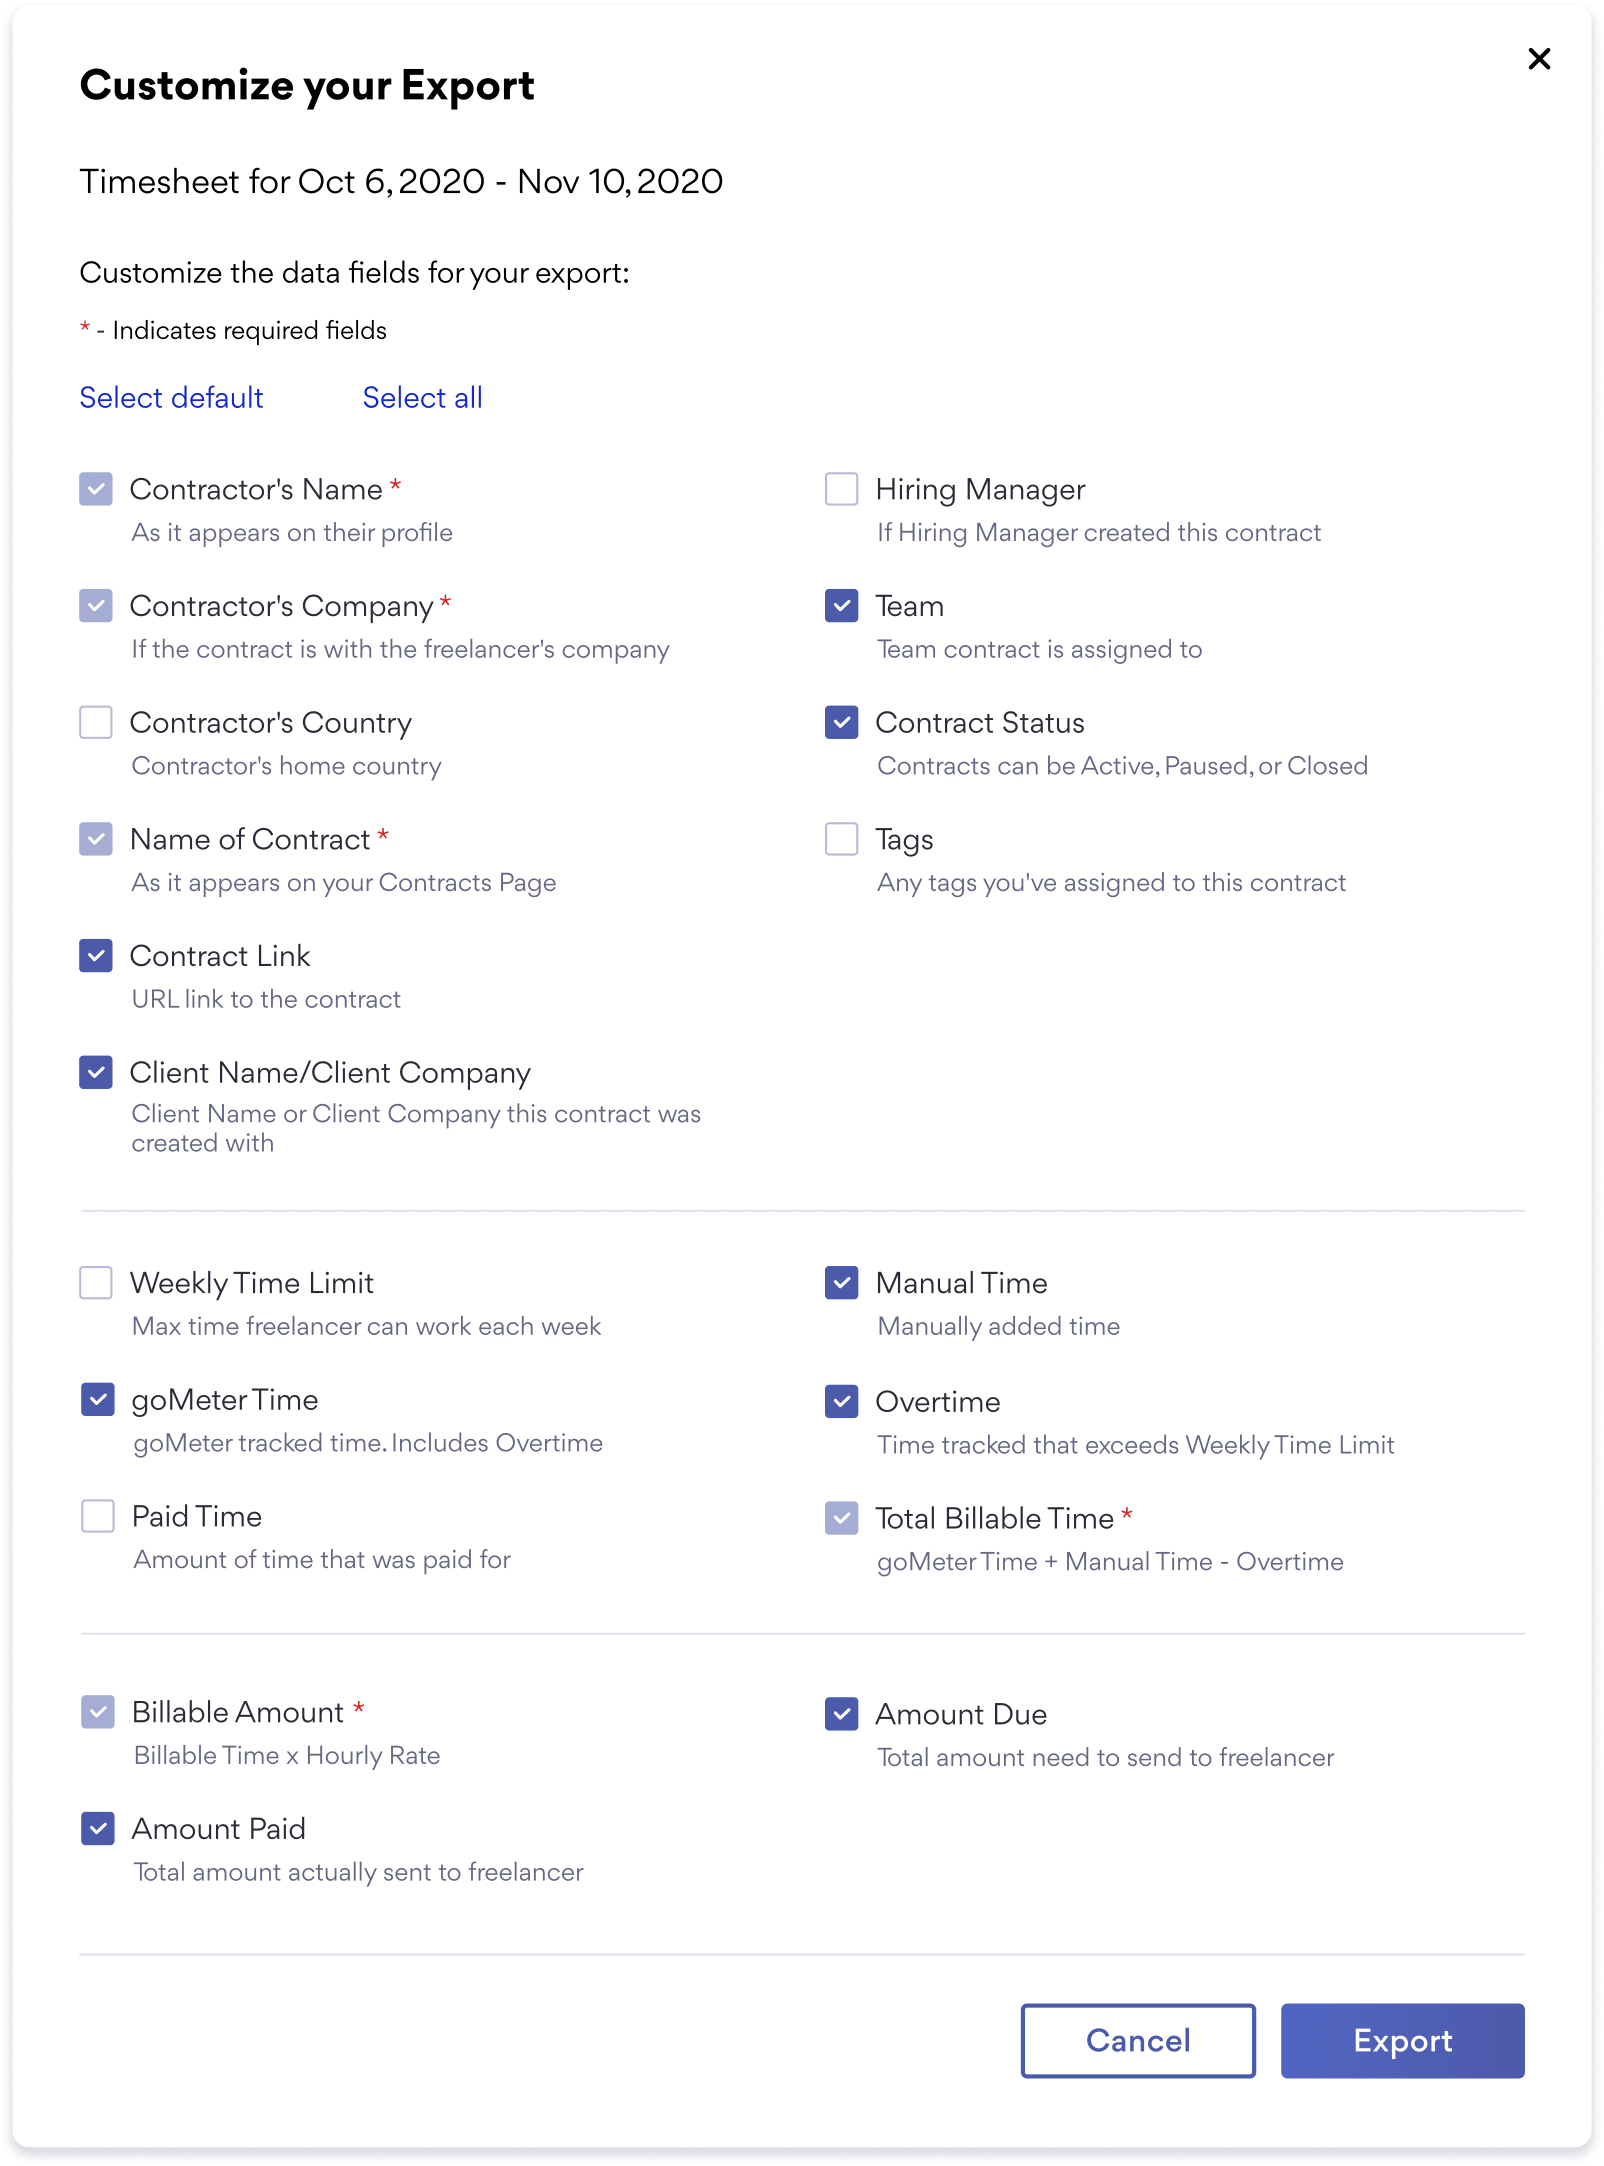
Finally, when it comes to exporting your reports, you can fully customize them thanks to 20 (twenty) checkboxes at your disposal.
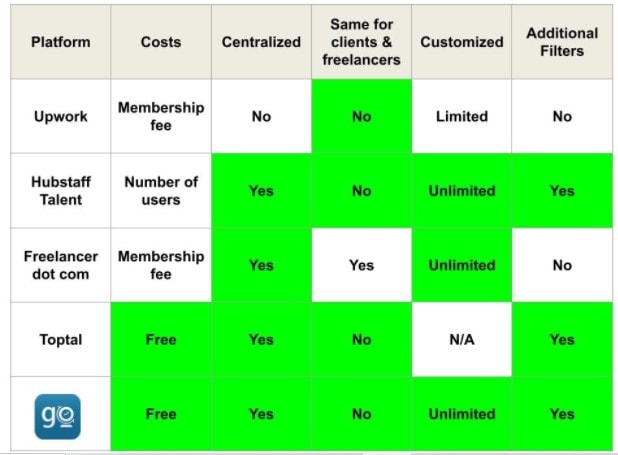
Instead of a conclusion, we will summarize our findings with the ultimate reports comparison table.
The Ultimate Reports Comparison Table